SaaS
Hosted by us · EU region
Edge units on-site, dashboard in our EU cloud. Fastest start. Monthly billing per scene. ISO 27001-controlled.
- Live in 1–3 weeks
- Monthly · per scene
- EU data residency
Ask your air, water, noise and traffic data a question. Get the answer, and the chart with it.
(r)Urban sits on top of the monitoring data you already store and turns it into something a non-technical colleague can use. No migration, no second copy of the truth — a read-only layer with the access rules built in.
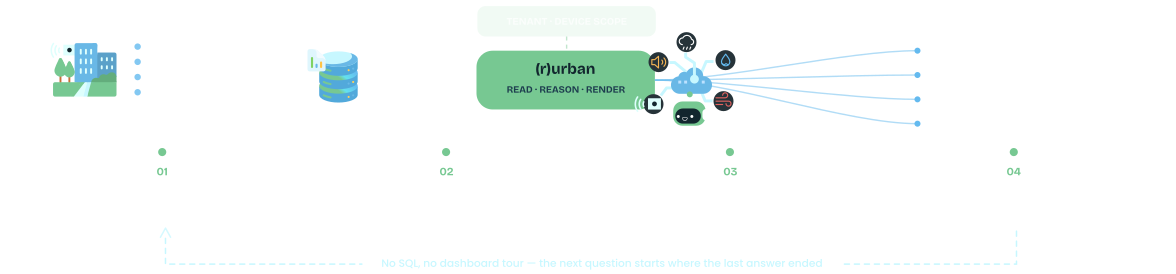
(r)Urban reads your existing PostgreSQL/TimescaleDB measurements and pre-aggregated minute, hour and day series. Ingestion, provisioning and calibration stay where they are.
Each customer, site or team is scoped to only the devices and measurement history that belong to them — set once when a tenant is provisioned, enforced on every question, chart and export after that.
Anyone on the team types a question in plain language instead of hunting through dashboards — the assistant answers from the live data and returns a chart when the answer is better shown than told.
When a question calls for more than a chat answer, the same tenant and device scope carries into the full air quality, history and traffic screens — no separate login, no re-picking the site.
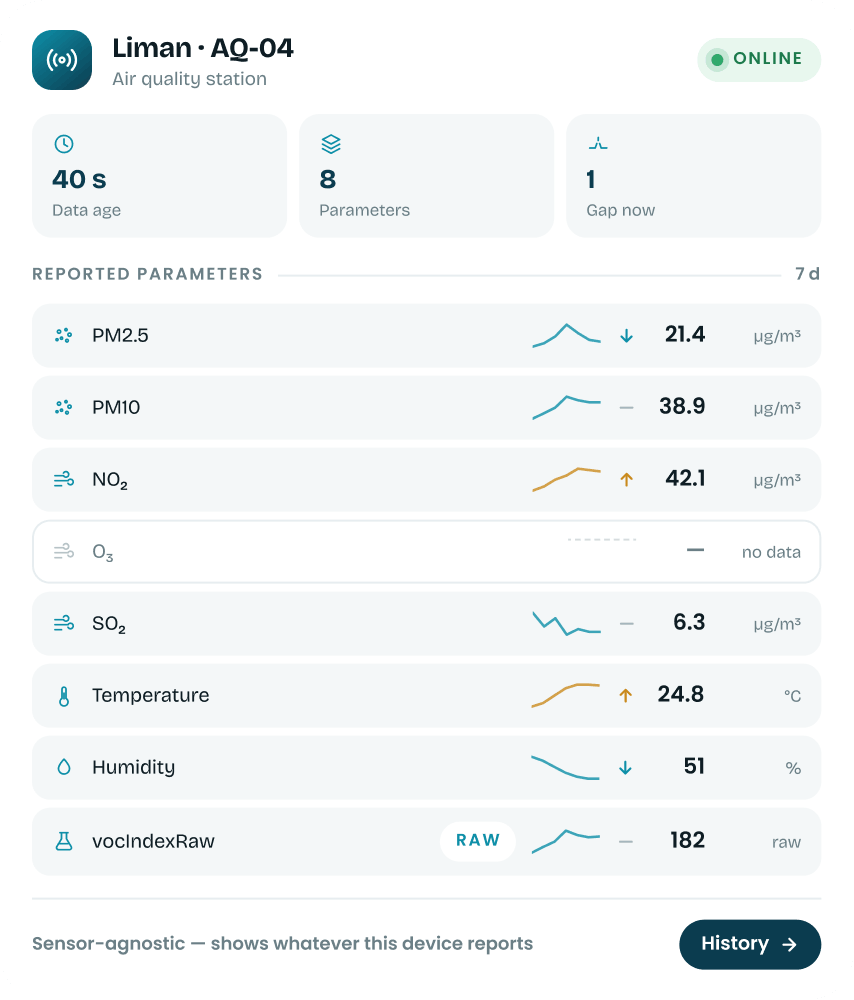
Charts inside the conversation, the device model underneath, the air quality index, history with export, and traffic by direction.
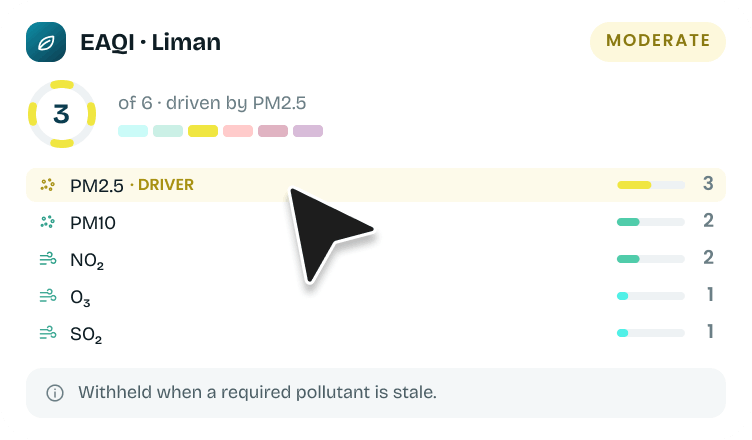
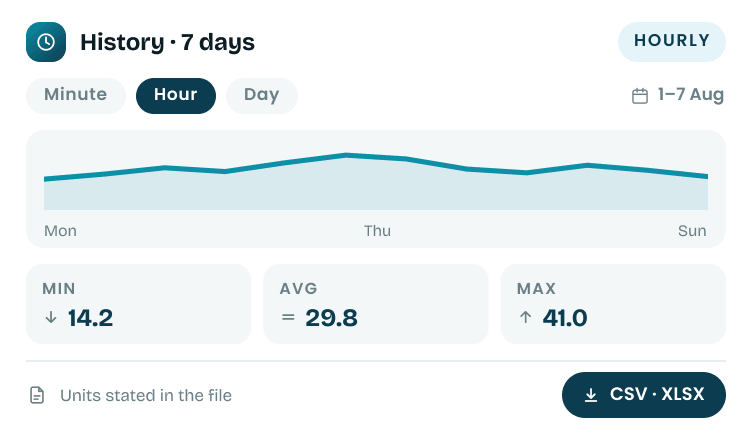
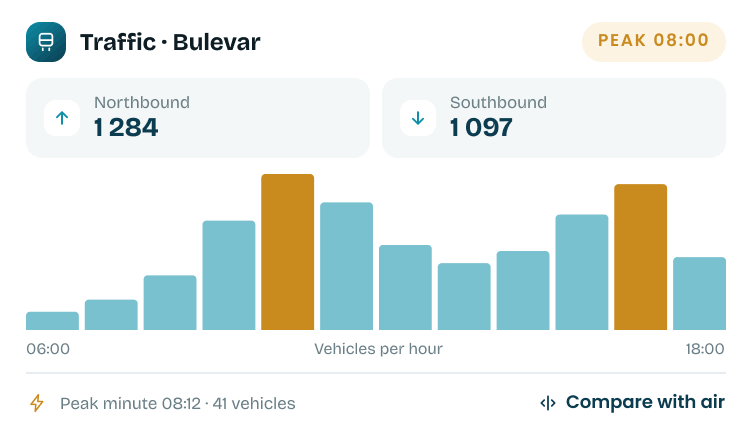
Ingestion, provisioning and calibration stay where they are. (r)Urban adds the layer that makes the measurements usable — and keeps every customer separated.
Need the data in your own systems? Exports ship in phase one and a public REST API in phase two, scoped against the interfaces you expose. Bring it up during the discovery call.
Your measurements
Time-series store you already run
(r)Urban
Read-only consumption layer
Your devices
Air · noise · water · traffic
Your teams
Operators, inspectors, analysts
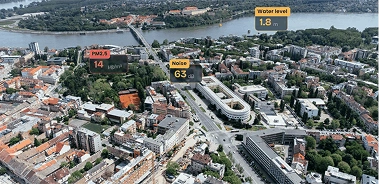
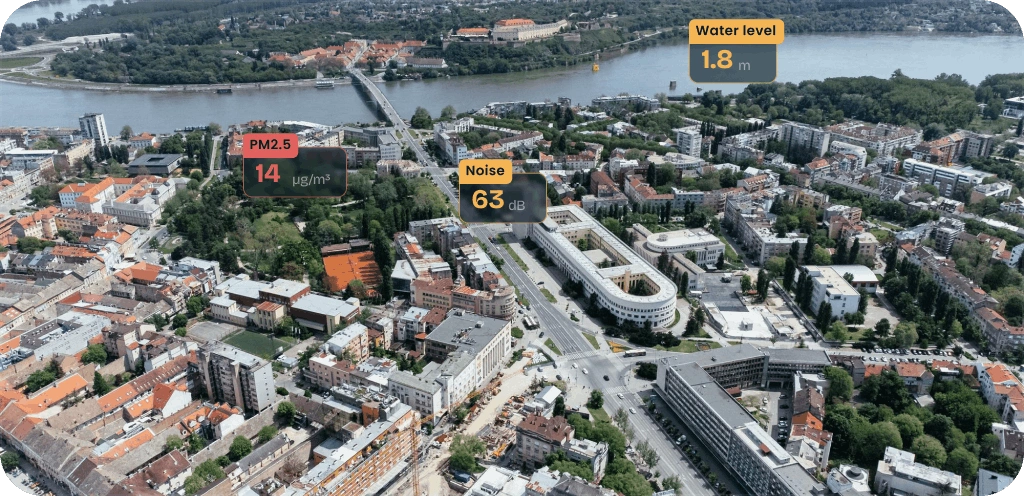
A complaint about night noise, a spike nobody can explain, a councillor asking whether the new bus lane changed anything.

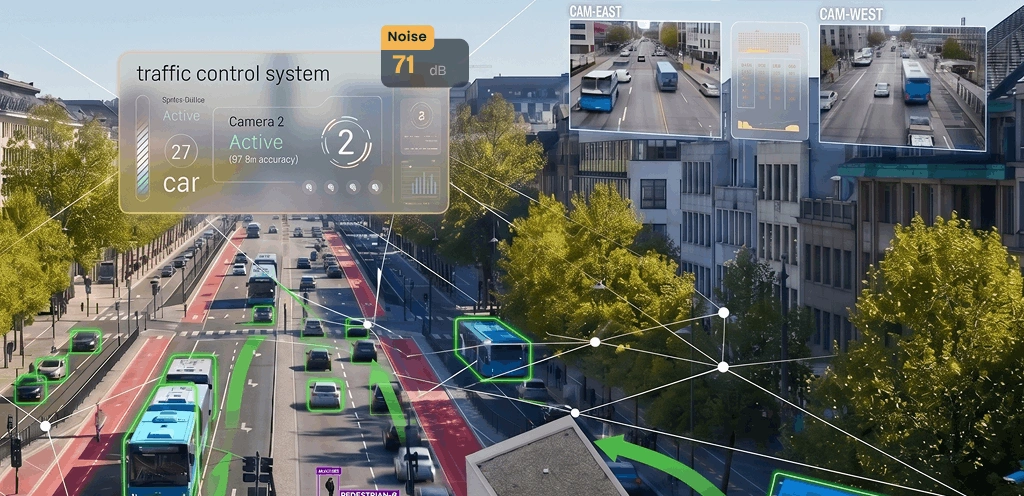
Edge units on-site, dashboard in our EU cloud. Fastest start. Monthly billing per scene. ISO 27001-controlled.
Event platform inside your Azure tenant. Your data residency, your compliance posture, our operations team.
Everything on your network, including dashboards — suits venues and networks with strict data policies. Via the DunavNET Innovation Studio engagement model.
Municipal deployment · 2025 · figures from the pilot
"We had the measurements for years. What we didn't have was a way for the people who need them — inspectors, the communications team, the councillor's office — to get an answer without going through us first."
Environmental Data Officer
City of Novi Sad · Serbia
No. It is a consumption layer over the time-series data you already store. Ingestion, device provisioning and calibration stay in your Device Management application; (r)Urban reads and never writes to the measurements.
Only the devices and history assigned to the asking user's tenant and device scope — set when the tenant is provisioned and enforced on every question, chart and export.
The assistant says so instead of guessing — a gap is reported as a gap, not filled in or estimated, and shows up as 'no data' on the affected reading.
From the standard EAQI sub-indices per pollutant, rolled up to the worst-performing one — the driving pollutant is always named alongside the overall score, not hidden behind a single number.
That's fine — (r)Urban is sensor-agnostic and only ever shows what a given device actually reports. A station without an ozone sensor shows 'no data' for ozone rather than a placeholder.
Yes. CSV/XLSX export ships in phase one for any question, chart or history view. A public REST API is planned for phase two, scoped against the interfaces you expose.
Yes — µg/m³, °C, % and similar readings display in standard units by default, with a raw-value toggle for anyone who wants the untransformed sensor output.
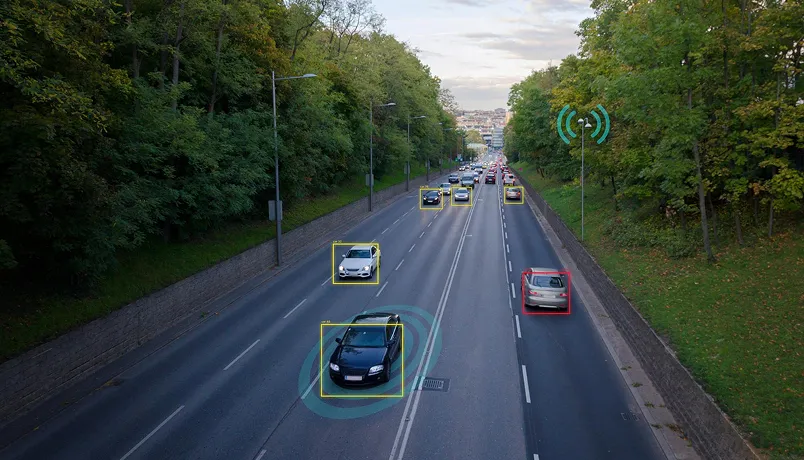
Counts by direction, peak hour and peak minute for the streets you already monitor, viewable on their own or alongside air quality and noise for the same location and time window.
The public REST API for pulling (r)Urban answers and exports into your own systems, scoped to the same tenant and device rules that apply everywhere else.
By deployment model — SaaS is billed monthly, Managed Azure and fully local engagements are scoped during the discovery call against your network and data policy.